

Buying options
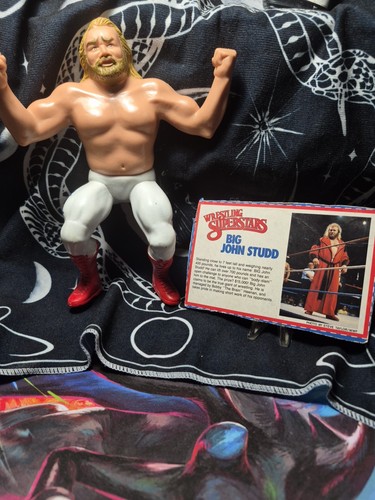
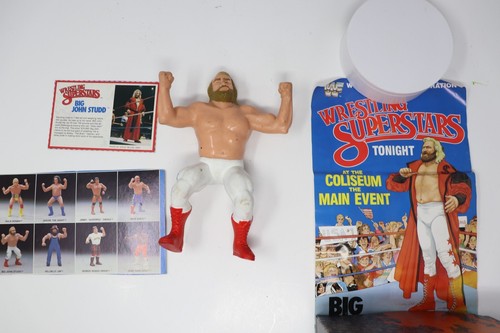
Big John Studd is part of the WWF LJN Wrestling Superstars line, produced during the 1980s before Hasbro took over the WWF figure license. Values should be checked against recent completed sales because loose condition, paint wear, rubber discoloration, accessories and card quality can create wide price differences.
Looking for comprehensive MOC Mint on Card value data? Big John Studd WWF LJN unopened value and sales history
This chart is Retrofigure's recommended value over time for the WWF LJN Big John Studd loose figure. Using sales data from various sources such as Ebay, Mercari and Etsy, our automated solution calculates an average value from the price of all sales.
Discover the methodology behind our data calculation: on a weekly basis, retrofigure diligently analyzes hundreds of finalized online sales transactions. By leveraging this valuable sale data, we precisely calculate the estimated value of collectibles as it evolves over time. Our algorithm uses the last 24 months of sales data.
Click to see all of our vintage wrestling figure stock at our Wrestling Figure Online Shop.
This chart is Retrofigure's recommended value over time for the WWF LJN Big John Studd loose figure with the accessory. We use the last 24 months of sales data as part of our calculations.
The table below presents a list of all sales of Big John Studd over the last 90 days, and contains the site on which the item was sold, the price that the figure had been sold for, and on the date that the transaction was concluded. The Retrofigure team also manually checks and ranks the quality of the figure that had been sold, and this is colour coded according to condition. For example, a perfect item would be marked with a green colour, an average condition item would receive an orange rating, and a poor quality item labelled brown.
| Date | Site | Price | State | |
|---|---|---|---|---|
 |
12th Jul | $8 | ||
 |
21st Jul | $25 | ||
 |
21st Jul | $9 | ||
 |
26th Jul | $18 | ||
 |
26th Jul | $20 | ||
 |
28th Jul | $5 | ||
 |
1st Aug | $19 | ||
 |
1st Aug | $14 | ||
 |
1st Aug | $12 | ||
 |
2nd Aug | $20 | ||
 |
7th Aug | $19 | ||
 |
7th Aug | $8 | ||
 |
8th Aug | $15 | ||
 |
10th Aug | $1 | ||
 |
11th Aug | $30 | ||
 |
17th Aug | $16 | ||
 |
18th Aug | $65 | ||
 |
20th Aug | $15 | ||
 |
20th Aug | $15 | ||
 |
24th Aug | $40 | ||
 |
27th Aug | $12 | ||
 |
27th Aug | $19 | ||
 |
29th Aug | $9 | ||
 |
30th Aug | $13 | ||
 |
30th Aug | $15 | ||
 |
2nd Sep | $10 | ||
 |
4th Sep | $29 | ||
 |
8th Sep | $22 | ||
 |
11th Sep | $15 | ||
 |
12th Sep | $14 | ||
 |
14th Sep | $15 | ||
 |
15th Sep | $6 | ||
 |
16th Sep | $30 | ||
 |
19th Sep | $6 | ||
 |
23rd Sep | $19 | ||
 |
25th Sep | $12 | ||
 |
26th Sep | $5 | ||
 |
29th Sep | $7 | ||
 |
30th Sep | $33 | ||
 |
2nd Oct | $40 | ||
 |
2nd Oct | $15 | ||
 |
2nd Oct | $17 | ||
 |
3rd Oct | $29 | ||
 |
5th Oct | $10 | ||
 |
10th Oct | $15 | ||
 |
10th Oct | $50 | ||
 |
11th Oct | $13 | ||
 |
12th Oct | $35 | ||
 |
14th Oct | $10 | ||
 |
15th Oct | $17 | ||
 |
16th Oct | $40 | ||
 |
17th Oct | $25 | ||
 |
21st Oct | $10 | ||
 |
21st Oct | $6 | ||
 |
21st Oct | $18 | ||
 |
24th Oct | $55 | ||
 |
26th Oct | $28 | ||
 |
28th Oct | $45 | ||
 |
5th Nov | $7 | ||
 |
5th Nov | $13 | ||
 |
8th Nov | $7 | ||
 |
9th Nov | $15 | ||
 |
11th Nov | $10 | ||
 |
11th Nov | $14 | ||
 |
12th Nov | $15 | ||
 |
16th Nov | $15 | ||
 |
17th Nov | $10 | ||
 |
18th Nov | $13 | ||
 |
20th Nov | $25 | ||
 |
22nd Nov | $25 | ||
 |
24th Nov | $10 | ||
 |
25th Nov | $8 | ||
 |
26th Nov | $25 | ||
 |
28th Nov | $3 | ||
 |
28th Nov | $36 | ||
 |
1st Dec | $23 | ||
 |
3rd Dec | $28 | ||
 |
5th Dec | $23 | ||
 |
5th Dec | $7 | ||
 |
6th Dec | $5 | ||
 |
7th Dec | $23 | ||
 |
8th Dec | $11 | ||
 |
8th Dec | $4 | ||
 |
9th Dec | $9 | ||
 |
9th Dec | $9 | ||
 |
9th Dec | $19 | ||
 |
9th Dec | $15 | ||
 |
11th Dec | $12 | ||
 |
12th Dec | $15 | ||
 |
12th Dec | $13 | ||
 |
13th Dec | $7 | ||
 |
17th Dec | $56 | ||
 |
18th Dec | $7 | ||
 |
18th Dec | $15 | ||
 |
18th Dec | $10 | ||
 |
22nd Dec | $8 | ||
 |
25th Dec | $30 | ||
 |
26th Dec | $18 | ||
 |
30th Dec | $22 | ||
 |
31st Dec | $20 | ||
 |
1st Jan | $16 | ||
 |
2nd Jan | $175 | ||
 |
2nd Jan | $14 | ||
 |
2nd Jan | $6 | ||
 |
3rd Jan | $6 | ||
 |
3rd Jan | $6 | ||
 |
3rd Jan | $12 | ||
 |
3rd Jan | $50 | ||
 |
3rd Jan | $14 | ||
 |
9th Jan | $9 | ||
 |
12th Jan | $6 | ||
 |
12th Jan | $17 | ||
 |
13th Jan | $45 | ||
 |
14th Jan | $26 | ||
 |
17th Jan | $30 | ||
 |
18th Jan | $70 | ||
 |
18th Jan | $12 | ||
 |
20th Jan | $19 | ||
 |
22nd Jan | $12 | ||
 |
24th Jan | $30 | ||
 |
24th Jan | $17 | ||
 |
27th Jan | $35 | ||
 |
28th Jan | $12 | ||
 |
29th Jan | $7 | ||
 |
29th Jan | $12 | ||
 |
29th Jan | $24 | ||
 |
30th Jan | $21 | ||
 |
30th Jan | $21 | ||
 |
31st Jan | $30 | ||
 |
31st Jan | $20 | ||
 |
2nd Feb | $12 | ||
 |
3rd Feb | $3 | ||
 |
5th Feb | $4 | ||
 |
7th Feb | $7 | ||
 |
7th Feb | $25 | ||
 |
9th Feb | $20 | ||
 |
11th Feb | $90 | ||
 |
12th Feb | $14 | ||
 |
13th Feb | $6 | ||
 |
13th Feb | $19 | ||
 |
13th Feb | $14 | ||
 |
17th Feb | $60 | ||
 |
20th Feb | $14 | ||
 |
25th Feb | $28 | ||
 |
28th Feb | $16 | ||
 |
28th Feb | $8 | ||
 |
1st Mar | $11 | ||
 |
2nd Mar | $13 | ||
 |
2nd Mar | $106 | ||
 |
4th Mar | $25 | ||
 |
9th Mar | Ebay | $15 | |
 |
13th Mar | Ebay | $20 | |
 |
15th Mar | Ebay | $3 | |
 |
16th Mar | Ebay | $42 | |
 |
17th Mar | Ebay | $20 | |
 |
21st Mar | Ebay | $15 | |
 |
21st Mar | Ebay | $25 | |
 |
22nd Mar | Ebay | $3 | |
 |
22nd Mar | Ebay | $15 | |
 |
24th Mar | Ebay | $9 | |
 |
24th Mar | Ebay | $79 | |
 |
24th Mar | Ebay | $10 | |
 |
26th Mar | Ebay | $30 | |
 |
27th Mar | Ebay | $20 | |
 |
27th Mar | Ebay | $8 | |
 |
4th Apr | Ebay | $8 | |
 |
5th Apr | Ebay | $44 | |
 |
9th Apr | Ebay | $4 | |
 |
11th Apr | Ebay | $27 | |
 |
18th Apr | Ebay | $24 | |
 |
19th Apr | Ebay | $15 | |
 |
21st Apr | Ebay | $18 | |
 |
2nd May | Ebay | $30 | |
 |
3rd May | Ebay | $80 | |
 |
3rd May | Ebay | $7 | |
 |
7th May | Ebay | $7 | |
 |
9th May | Ebay | $38 | |
 |
11th May | Ebay | $61 | |
 |
11th May | Ebay | $15 | |
 |
14th May | Ebay | $45 | |
 |
18th May | Ebay | $5 | |
 |
21st May | Ebay | $25 | |
 |
23rd May | Ebay | $37 | |
 |
23rd May | Ebay | $12 | |
 |
23rd May | Ebay | $40 | |
 |
24th May | Ebay | $12 | |
 |
24th May | Ebay | $12 | |
 |
26th May | Ebay | $27 | |
 |
27th May | Ebay | $10 | |
 |
27th May | Ebay | $16 | |
 |
28th May | Ebay | $10 | |
 |
29th May | Ebay | $15 | |
 |
31st May | Ebay | $10 | |
 |
1st Jun | Ebay | $32 | |
 |
12th Jun | Ebay | $20 | |
 |
14th Jun | Ebay | $89 | |
 |
14th Jun | Ebay | $17 | |
 |
17th Jun | Ebay | $26 | |
 |
21st Jun | Ebay | $35 | |
 |
22nd Jun | Ebay | $35 | |
 |
28th Jun | Ebay | $26 | |
 |
5th Jul | Ebay | $42 |
This chart is a visual representation of all of the sales that we have detected for the Big John Studd figure. Retrofigure uses this data to calculate a fair value for the collectible.
This chart visualizes sales of the Big John Studd collectible, helping collectors understand how its market value has changed over time. Based on real-world transactions from marketplaces like eBay and Mercari, Retrofigure analyzes this data to estimate a fair value for the figure today. This chart is a visual representation of all of the sales that we have detected for the Big John Studd figure. Retrofigure uses this data to calculate a fair value for the collectible.
This chart visualizes sales of the Big John Studd collectible, helping collectors understand how its market value has changed over time. Based on real-world transactions from marketplaces like eBay and Mercari, Retrofigure analyzes this data to estimate a fair value for the figure today. This chart is a visual representation of all of the sales that we have detected for the Big John Studd figure. Retrofigure uses this data to calculate a fair value for the collectible.

